METHODOLOGY
Study Area
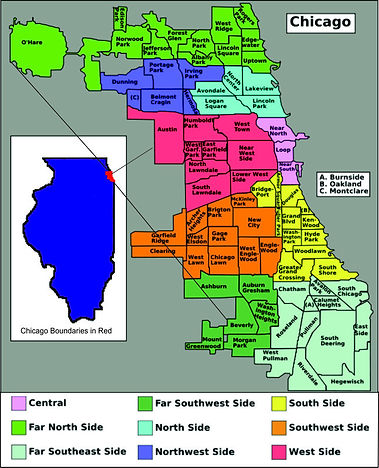
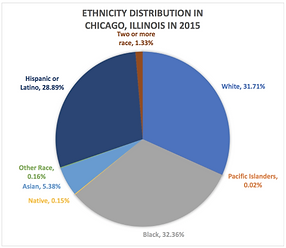
The study area is located in Chicago, Illinois. More than half the population of the state of Illinois lives in the Chicago metropolitan area, so Chicago is one of the US’ most densely populated major cities. Its population is around 2.7 million. It is also a very diverse city which its household income, ethnicity, and age groups are relatively evenly distributed. There are sixty-eight reported toxics release facilities in Chicago.

Data
Chicago Data Portal
-
Boundaries - Community Areas (2017)
TOXMAP: Environmental Health Maps
-
Toxics Release Inventory: All Chemicals (2016)
Chicago Metropolitan Agency for Planning Data Hub
-
Data based on 2015 American Community Survey
-
Total population
-
Age:
-
Under 19
-
20-34
-
35-49
-
50-64
-
65-79
-
Over 80
-
-
Race and Ethnicity:
-
White
-
Black
-
Hispanic or Latino
-
Asian
-
Other
-
-
Unemployment rate
-
Household income:
-
Less than $25k
-
$25k-$49k
-
$50k-$74k
-
$75k-$99k
-
$100k-$149k
-
Over $150k
-
Chicago Police Department
-
Incidents of crime in the past 365 days (from April 10, 2017 - April 10, 2018)


Exploratory Regression
Regression analysis is a statistical modeling process that helps to evaluate the relationship between two or more variables. It is commonly used in the realm of social sciences. This helps to identify and understand the spatial pattern in an area, predict what is likely to occur in the future, as well as examining causes of why specific phenomena happened (ArcGIS Resource Centre).
Exploratory regression is one the regression analysis tools that builds OLS models using all possible combinations for a given list of candidate explanatory variables and assesses which models pass the necessary OLS checks (ArcGIS Pro). This project uses the exploratory regression tool in ArcGIS to examine the relationship between each type of crimes and different socio-economic variables.
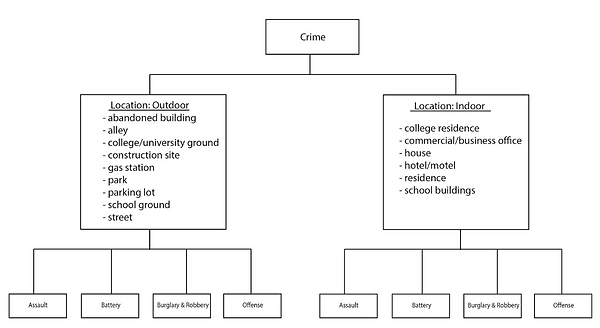
Types of crimes include: assault, battery, burglary and robbery, and offense (sexual offense, offenses involving children, other offenses). Socio-economic variables include: percentage of population age cohorts, percentage of race and ethnicity, unemployment rate, and percentage of household income.
The dependent variables are each type of crimes and the explanatory variables the socio-economic variables. After running the analysis, the set of variables with the highest adjusted R^2 value and the lowest AICc (Akaike information criterion) is deemed most important variables.
CrimeStat: Hot Spot Analysis (Fuzzy Mode)
Hot spots are concentrations of incidents within a limited geographical area that appears over time (Braga & Weisburd, 2010). Hot spot analysis helps to identify clusters of crime incidents (Levine). There are several statistical techniques designed to measure clusters in CrimeStat. For example, point locations is the most intuitive type of cluster involving the number of incidents occurring at different locations, where locations with the most number of incidents are defined as hot spots (Levine). There are two point location methods: the Mode and Fuzzy Mode.
This project uses the Fuzzy Mode point location hot spot analysis to determine if there are clusters within each type of crime. We also divide each type of crime into outdoor locations and indoor locations. Each of crime incidents is assigned to X and Y coordinates. The Mode would not be a useful tool for our analysis because for example, assigning the vehicle theft location to a particular stall in a parking lot will lead to few locations coming up more than once (Levine). Consequently, the Fuzzy Mode allows us to define search radius, in this case, a 3,000 feet radius is set around each crime location to include events that occur around or near that location. One advantage of the Fuzzy Mode routine is that it helps to identify small hot spot areas rather than exact locations. Moreover, inputting a search radius around the coordinates allow a number of events to be grouped together whereas exact locations might no identify that grouping (Levine).
Kernel Density
Kernel density calculates a magnitude-per-unit area from point features using a kernel function to fit a smoothly tapered surface to each point (ArcGIS Pro). This project uses kernel density to map total chemical emissions from located toxics release facilities. From each facility location, the distance to each point evaluated and summed for all of the pixels around the reference location.